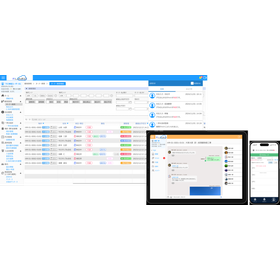
We provide a spreadsheet optimized for array analysis! It can handle biopolymers.
"SARvision Biologics" is a desktop application that fills the gaps in existing biologics software. It provides foundational tools for reading and organizing data on biopolymers, as well as various tools to discover relationships between sequences and activities. A spreadsheet optimized for sequence analysis is provided, allowing for the handling of biopolymers such as nucleic acids, proteins, and peptides, including non-natural amino acids and chemically modified residues. 【Features】 ■ Supports research on peptides, antibodies, and RNA ■ Capable of handling peptides that include non-natural amino acids, cyclization, and chemical modifications ■ Visualization function for activity using heat maps ■ Highlights areas of interest *For more details, please refer to the PDF materials or feel free to contact us.
Inquire About This Product
basic information
【Other Features】 ■ Exploration of mutations that significantly impact activity (Logo Plot, Invariant Map, Mutation Cliff) ■ Loading and alignment of sequence data (automatic and manual) ■ Implementation of a numbering algorithm based on ANARCI for automatic numbering of antibodies (compatible with Kabat, Chothia, Enhanced Chothia, IMGT, AHo) ■ Ability to examine hundreds of sequences *For more details, please refer to the PDF document or feel free to contact us.
Price range
Delivery Time
Applications/Examples of results
【Usage】 ■ Biopolymers such as nucleic acids, proteins, and peptides that contain non-natural amino acids or chemically modified residues. *For more details, please refer to the PDF document or feel free to contact us.
Detailed information
-

LogoPlot is a general method for summarizing sequence motifs that indicate biological functions. These logos take the form of stacked letters enclosed in rectangles or bars, with heights scaled according to frequencies or some aggregated activities within the dataset. The Y-axis controls the activity fields and methods used for height scaling. There are two chart styles: sequence logos and sequence bars. Sequence logos perform statistics based on a basic set of 20 natural amino acids and scale font sizes. In contrast, sequence bar plots can use any number of monomers for scaling based on the data.
-
The mutation set indicates the relationship of sequence activity at specific positions. It can identify all sequences that are identical except for a single position. The mutation set family forms a series where the substitution pattern at a single position directly correlates with changes in activity. This provides confidence that the correlation is realistic and significant, as all confounding mutations or mutations at other locations in the sequence are excluded from the analysis.
catalog(1)
Download All CatalogsCompany information
Patocoa Inc. is a specialized company in drug discovery support systems. We are also focused on improving and streamlining compliance-related operations concerning regulated substances, and we have provided various solutions primarily to pharmaceutical companies, as well as chemical companies, universities, and government agencies. We contribute to accelerating drug discovery and reducing costs with our cutting-edge cheminformatics systems.

![Mutation_Set_th2[1].PNG](https://image.www.ipros.com/public/product/image_diagram/d51/2000658208/IPROS8022489847141342730.PNG?w=140&h=140)


![[Today's ANSYS] Utilized for water flow simulation (LIXIL)](https://image.www.ipros.com/public/product/image/6cc/2000385221/IPROS2600147988298471188.png?w=280&h=280)


