Visualization - メーカー・企業39社の製品一覧とランキング | イプロス

更新日: 集計期間:Jul 22, 2026~Aug 18, 2026
※当サイトの各ページの閲覧回数を元に算出したランキングです。

Visualizationのメーカー・企業ランキング

更新日: 集計期間:Jul 22, 2026~Aug 18, 2026
※当サイトの各ページの閲覧回数を元に算出したランキングです。

  1. ITOCHU Aviation Co., Ltd. Tokyo//Trading company/Wholesale
  2. フロアエージェント Tokyo//Other construction industries
  3. ハーモナイズ Fukushima//Trading company/Wholesale
  4. 4 レンタルのニッケン 東京本社 Tokyo//Service Industry
  5. 5 LayerX Tokyo//Information and Communications

Visualizationの製品ランキング

更新日: 集計期間:Jul 22, 2026~Aug 18, 2026
※当サイトの各ページの閲覧回数を元に算出したランキングです。

  1. "Portcast," a visualization service for maritime transport that realizes SCM (Supply Chain Management). ITOCHU Aviation Co., Ltd.
  2. Body Water Meter [Hydro Balance Meter] | Non-invasive visualization of dehydration risk ハーモナイズ
  3. Floor irregularity inspection service | Visualizing the overall level, irregularities, and undulations of the floor. フロアエージェント
  4. 4 Floor Accuracy Survey | Visualizing Floor Issues Before Automating Logistics Warehouses and Factories フロアエージェント
  5. 5 Usage status of AI services and cost visualization "AI Token Advisor" LayerX

Visualizationの製品一覧

1~30 件を表示 / 全 56 件

表示件数

Simple electronic map

This is a service that converts information you want to display as text on a map.

- Display various information on maps on smartphones and PCs - Just upload Excel data - Cloud service using free maps

  • Other Software
  • Visualization

ブックマークに追加いたしました

ブックマーク一覧

ブックマークを削除いたしました

ブックマーク一覧

これ以上ブックマークできません

会員登録すると、ブックマークできる件数が増えて、ラベルをつけて整理することもできます

無料会員登録

IoT Data Visualization Service

You can visualize various information at the timing you want to see it! Contributing to business efficiency and improvement.

The "IoT Data Visualization Service" is a service that visualizes various information at the desired timing. It receives IoT data in real-time and continuously displays the latest information on the screen. For example, in the "Power Usage Monitoring and Management Service," clip sensors are installed for each wiring of the distribution board to collect power usage data for each device. This data can be viewed through a web browser. By visualizing power data, you can quickly grasp the company's power usage status at a glance, enabling the reduction of power consumption. Additionally, analyzing the data can help improve operational efficiency and business processes. 【Features】 ■ Visualization at the desired timing ■ Real-time reception of IoT data ■ Continuous display of the latest information on the screen *For more details, please refer to the PDF document or feel free to contact us.

ブックマークに追加いたしました

ブックマーク一覧

ブックマークを削除いたしました

ブックマーク一覧

これ以上ブックマークできません

会員登録すると、ブックマークできる件数が増えて、ラベルをつけて整理することもできます

無料会員登録

Q&A Collection on Visualization of Production Sites [From Streaming Terakoya]

Solving doubts about the visualization of production sites! *Excerpt from the Zuken Elmic Co., Ltd. knowledge base site "Streaming Terakoya."

The Streaming Terakoya is a practical knowledge base for engineers developing data streaming and network functionalities. It compiles hints and our practical know-how in a Q&A format to solve challenges in the development of devices and systems. It is particularly aimed at intermediate to advanced users who require low latency and simultaneous multiple connections. This time, we would like to introduce the "Q&A Collection on Visualizing Production Sites." We provide know-how gained through our video utilization system construction service using our video, FA, and AI collaboration platform, "FA Finder," in a Q&A format. [Examples of Q&A] *Excerpt ■Q1: I want to utilize camera footage in the production site; what points should I pay attention to initially? ■Q2: Is there an easy way to compare footage from cameras installed at points where issues occur in the factory with footage from cameras used for overall monitoring? And more. *Please refer to the materials for more details. Feel free to contact us with any inquiries.

  • Video Monitoring System
  • Visualization

ブックマークに追加いたしました

ブックマーク一覧

ブックマークを削除いたしました

ブックマーク一覧

これ以上ブックマークできません

会員登録すると、ブックマークできる件数が増えて、ラベルをつけて整理することもできます

無料会員登録

CAE post-processing and data visualization Altair HyperGraph

2D/3D CAE - Experimental data analysis and plot creation

Altair HyperGraph is a data analysis and graphing tool aimed at engineering data such as analysis results from numerous major CAE solvers. With its intuitive interface and powerful mathematical engine, advanced mathematical calculations can be easily handled. By leveraging HyperGraph's high-quality display output, effective report generation becomes possible, and the process automation features dramatically improve report creation efficiency.

  • others
  • Visualization

ブックマークに追加いたしました

ブックマーク一覧

ブックマークを削除いたしました

ブックマーク一覧

これ以上ブックマークできません

会員登録すると、ブックマークできる件数が増えて、ラベルをつけて整理することもできます

無料会員登録

Data Visualization "i-Reporter × MotionBoard"

Achieving both paperless operations and visibility on-site!

■ Electronic Document System "i-Reporter" Familiar Excel forms can be converted directly into electronic forms. You can digitize and go paperless without changing the benefits of handwritten paper forms. ■ Real-Time Visualization Tool "MotionBoard" Any data can be transformed into the desired image. With diverse expressions, various data is visualized in real-time. ● Issues Addressed - Significant effort required for inputting actual results - Delays in response due to reporting time lag - Necessary data for analysis is missing ◆ For more details, please download the catalog ◆

ブックマークに追加いたしました

ブックマーク一覧

ブックマークを削除いたしました

ブックマーク一覧

これ以上ブックマークできません

会員登録すると、ブックマークできる件数が増えて、ラベルをつけて整理することもできます

無料会員登録

Experience-based showroom where you can choose courses tailored to your objectives.

We have prepared three courses tailored to the customer's objectives and preferences. It is possible to find suitable storage while actually experiencing the storage solutions.

In our showroom, you can choose a course that suits your needs. We recommend starting with the experience course to visualize your individual storage concerns and ideals, and explore solutions. Once you have a clear vision of your ideal storage, we will propose a user-friendly storage plan from product selection in the planning course. 【Course Details】 ■ Experience Course (Duration: 90 minutes) ■ Planning Course (Duration: 90 minutes) ■ Self Course (Duration: 90 minutes) We have showrooms in four locations: Tokyo, Nagoya, Osaka, and Kagawa. As we operate by appointment only, please make a reservation through the "Internet Reservation" link provided. *For more details, please refer to the PDF document or feel free to contact us.

ブックマークに追加いたしました

ブックマーク一覧

ブックマークを削除いたしました

ブックマーク一覧

これ以上ブックマークできません

会員登録すると、ブックマークできる件数が増えて、ラベルをつけて整理することもできます

無料会員登録

4D visualization software 4D visualization MVS/EVS

4D Visualization Software 4D Visualization MVS/EVS

This powerful software not only reduces the costs of field surveys and assessments but also provides strong support across a wide range of areas including analysis, presentation, conservation, prevention, restoration, as well as funding planning, litigation, regulations, and construction methods. EVS/MVS is a customizable 3D analysis and visualization software. ○EVS-Standard The most basic EVS-Standard includes customizable modules for geological and environmental use. For example, it features 3D model construction capabilities using differential or automatic mesh division, 3D panel diagrams, simultaneous data analysis for multiple types, and functions for creating cross-sections and cut models. In addition to these features, it has pre-data creation and post-3D modeling capabilities for standard fluid analysis programs such as MODFLOW, MT3D, and CFEST.

  • Scientific Calculation and Simulation Software
  • Visualization

ブックマークに追加いたしました

ブックマーク一覧

ブックマークを削除いたしました

ブックマーク一覧

これ以上ブックマークできません

会員登録すると、ブックマークできる件数が増えて、ラベルをつけて整理することもできます

無料会員登録

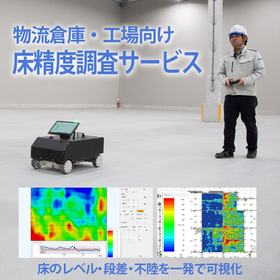
Floor Accuracy Survey | Visualizing Floor Issues Before Automating Logistics Warehouses and Factories

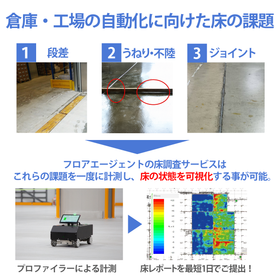
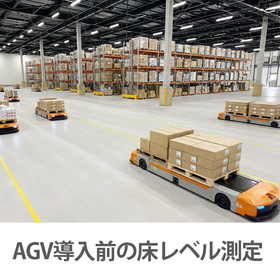
Before the introduction of AGVs, AMRs, and high-rise racks, we measure the floor's unevenness, undulations, irregularities, groove width, and the condition of joint areas all at once. We can provide the documentation in as little as one day!

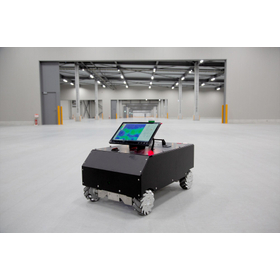
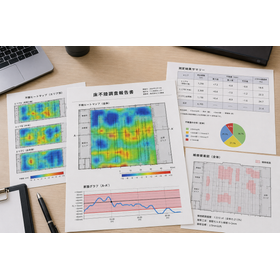
The floor accuracy survey service is designed to investigate whether the floor meets the running conditions for automated guided vehicles (AGVs, AMRs) in logistics warehouses and factories. Using a dedicated floor measuring device called a floor profiler, we measure the floor's unevenness, undulations, irregularities, groove widths, and the condition of joint areas all at once, visualizing the results in graphs and numerical data. After the measurement, we provide a floor report that includes: 01. Unevenness heat map 02. Detailed floor level sheet 03. Cross-sectional diagram of measurement lines These can serve as reference materials when considering floor renovations and can also be used as sales materials for tenants. According to JASS-5, the standard for floor level is ±7mm within 3 meters, but our floor accuracy survey service can measure with even higher precision standards. We can conduct surveys for both new and existing buildings, and we also accommodate measurements for transport pathways only. Additionally, if floor corrections are needed after the survey, we can handle various works such as step elimination, unevenness correction, and floor repair, so you can leave everything to us. Surveys can be conducted nationwide, so please contact Floor Agent first.

  • Automated guided vehicles (AGV, RGV)
  • Automated warehouse (AS, RS)
  • Other measuring instruments
  • Visualization

ブックマークに追加いたしました

ブックマーク一覧

ブックマークを削除いたしました

ブックマーク一覧

これ以上ブックマークできません

会員登録すると、ブックマークできる件数が増えて、ラベルをつけて整理することもできます

無料会員登録

Achieve reduced operational costs and risks! Visualize vulnerabilities with Invicti.

By setting the target website and starting the scan, vulnerabilities can be automatically detected! No special knowledge of security is required.

Invicti can automatically detect vulnerabilities by setting up the target website and starting a scan. By utilizing the scheduling feature, it is also possible to configure regular scan executions. The vulnerabilities detected in the scan results are displayed in a list categorized by severity, and reports can be generated in formats compliant with various compliance requirements. These features simultaneously reduce security-related operational costs and mitigate the risk of being affected by attacks from unknown threats.

  • Security Assessment
  • Visualization

ブックマークに追加いたしました

ブックマーク一覧

ブックマークを削除いたしました

ブックマーク一覧

これ以上ブックマークできません

会員登録すると、ブックマークできる件数が増えて、ラベルをつけて整理することもできます

無料会員登録

Visualize inherent vulnerabilities! Web vulnerability scanner 'Invicti'

Scan websites from the outside and visualize inherent vulnerabilities! Achieve both reduced operational costs and risk mitigation simultaneously.

"Invicti" is a web vulnerability scanner that automatically detects vulnerabilities by setting up the target website and starting the scan. By utilizing the scheduling feature, it is also possible to configure regular scan executions. The vulnerabilities detected in the scan are displayed in a list categorized by their severity, and reports can be generated in formats compliant with various compliance requirements. 【Features】 ■ Centralized management of detected vulnerabilities and confirmation of results regardless of time and place, as well as re-testing after vulnerability remediation. ■ Detection and scanning of applications, services, and technologies used within the website, and identification of areas that require protection. ■ Scheduling feature that enables regular automated scans. ■ Scanning for vulnerabilities listed in compliance requirements such as OWASP Top 10 and PCI DSS, and creation of reports in accordance with each requirement. *For more details, please refer to the PDF materials or feel free to contact us.

ブックマークに追加いたしました

ブックマーク一覧

ブックマークを削除いたしました

ブックマーク一覧

これ以上ブックマークできません

会員登録すると、ブックマークできる件数が増えて、ラベルをつけて整理することもできます

無料会員登録

Business Visualization Platform 'Ark'

A business visualization platform that enables the identification of bottlenecks in operations.

"Ark" is a business visualization platform that accelerates RPA. By making business processes visible, it eliminates dependency on individuals and enables the measurement of the effectiveness of systems and RPA. Additionally, it can be used immediately without any initial costs or setup required. Please feel free to contact us if you have any inquiries. 【Features】 ■Reduction of man-hours in the upstream processes of systemization (automation) ■Business automation and cost reduction through business visualization ■Data-driven, ensuring no discrepancies *For more details, please download the PDF or contact us.

ブックマークに追加いたしました

ブックマーク一覧

ブックマークを削除いたしました

ブックマーク一覧

これ以上ブックマークできません

会員登録すると、ブックマークできる件数が増えて、ラベルをつけて整理することもできます

無料会員登録

Toilet congestion relief service

From visualizing congestion to resolution, and monetization through advertising! Introducing VACAN's services for restrooms.

VACAN's "Toilet Congestion Relief Service" begins with improving convenience through the visualization of toilet congestion, alleviating crowding by deterring long usage times, and is an IoT service that can even generate revenue through advertising distribution. We offer "Throne," which visualizes congestion status using sensors, and the optional "AirKnock," which displays congestion status on digital signage inside the restroom stalls. Additionally, we have "AirKnock Ads," which delivers video advertisements and announcements on tablets inside the restroom stalls, achieving "toilet congestion relief + monetization." 【Features】 ■ Easily check real-time usage status ■ Can suppress long usage times in stalls ■ Can generate revenue through advertising distribution ■ Can analyze usage time data and more *For more details, please refer to the PDF document or feel free to contact us.

  • IoT
  • Other commercial buildings and service facilities
  • Visualization

ブックマークに追加いたしました

ブックマーク一覧

ブックマークを削除いたしました

ブックマーク一覧

これ以上ブックマークできません

会員登録すると、ブックマークできる件数が増えて、ラベルをつけて整理することもできます

無料会員登録

Visualization of ideas! Opinion collection platform "Idea Box"

It can also be applied to new business planning and product development, visualizing ideas. It's a platform for soliciting opinions that makes commenting and brainstorming easy!

"Idea Box 2.0" is a feedback collection platform specialized for government and local authorities, adopted by the Digital Agency of the Cabinet Secretariat. By allowing citizens to propose and solve issues they are facing, and prioritize them, it visualizes what the administration and politics should be focusing on now. The system analyzes ideas from various angles to ensure a neutral and fair response. It addresses challenges faced by existing feedback collection methods, such as variability in opinions, dissatisfaction with responses to opinions, and difficulty in gathering feedback. [Features] - Ideas developed from opinion exchanges lead to balanced suggestions. - Citizens can confront issues together with the administration and politics. - The expression of opinions is invigorated through voting and comments. *For more details, please download the PDF or feel free to contact us.

  • Document Management System
  • Visualization

ブックマークに追加いたしました

ブックマーク一覧

ブックマークを削除いたしました

ブックマーク一覧

これ以上ブックマークできません

会員登録すると、ブックマークできる件数が増えて、ラベルをつけて整理することもできます

無料会員登録

System Asset Streamlining and Visualization Service

Accelerate IT capabilities all at once! By visualizing the scale and structure of system assets, gain an understanding of the current state of existing systems in a short period.

We offer a "System Asset Streamlining and Visualization Service." This service reduces maintenance and operational man-hours, lowering the costs associated with functionality difference analysis and evaluation when considering new systems. Additionally, by visualizing data structures, we can respond flexibly and quickly to system adaptations for new business models. 【Features】 ■ Visualization of the scale and structure of system assets allows for a quick understanding of the current state of existing systems. ■ Reduction in maintenance and operational man-hours, leading to lower costs for functionality difference analysis and evaluation when considering new systems. ■ Flexible and rapid response to system adaptations for new business models. ■ By implementing BI tools, we can quickly create real-time management materials. *For more details, please refer to the PDF document or feel free to contact us.

  • Other Management Services
  • Visualization

ブックマークに追加いたしました

ブックマーク一覧

ブックマークを削除いたしました

ブックマーク一覧

これ以上ブックマークできません

会員登録すると、ブックマークできる件数が増えて、ラベルをつけて整理することもできます

無料会員登録

Business improvement solution

Utilizing our core technology "Deep Listening" for companies aiming to enhance organizational capabilities.

We provide business improvement solutions that start with interviews for mid-sized to large companies, aiming to structure, visualize, document, and verbalize the knowledge, ideas, know-how, and opinions that lie dormant within individual employees. By conducting interviews that ensure trust and psychological safety in the design of appropriate challenges/goals and solutions, we can create deliverables that align with the objectives. Unlike typical projects led by consultants or writers, we conduct genuine interviews that meet business requirements and connect to tangible outcomes. 【Service Contents】 ■ Visualization of business processes and challenges ■ Support for visualizing and sharing internal know-how ■ Visualization of management's thoughts and know-how ■ Training ■ Other solutions *For more details, please feel free to contact us.

  • Employee training
  • Visualization

ブックマークに追加いたしました

ブックマーク一覧

ブックマークを削除いたしました

ブックマーク一覧

これ以上ブックマークできません

会員登録すると、ブックマークできる件数が増えて、ラベルをつけて整理することもできます

無料会員登録

DALI lighting control LCD touch panel switch white visualization

DALI LCD touch panel switch that can visualize the current scene and schedule with a circle.

【Features】 ■ 5-inch LCD capacitive touch switch ■ Up to 20 customizable buttons ■ Date and time display ■ Beep sound on touch, selectable ■ Customizable button text (Unicode) ■ Can display the progress of dimming (up, down) timer. ■ Options to display a blank page, time, date and time, or user-defined logo ■ Supports Japanese, English, etc. ■ Adjustable screen brightness and automatic brightness control for timeout after touch ■ Automatic brightness control via proximity sensing and change from fallback page to button display ■ Smooth dimming and color adjustment from 0.1%, easy spatial effects!

  • System lighting and lighting control
  • Lighting Planning
  • Spatial Design
  • Visualization

ブックマークに追加いたしました

ブックマーク一覧

ブックマークを削除いたしました

ブックマーク一覧

これ以上ブックマークできません

会員登録すると、ブックマークできる件数が増えて、ラベルをつけて整理することもできます

無料会員登録

DALI lighting control LCD touch panel black button name visualization

DALI LCD touch panel switch that can visualize the ongoing scenes and schedules with a circle.

**Features** - 5-inch LCD capacitive touch switch - Up to 20 customizable buttons - Date and time display - Beep sound upon touch, selectable - Customizable button text (Unicode) - Can display the progress of dimming (up, down) timers - Options to display a blank page, time, date and time, or user-defined logo - Supports Japanese, English, and more - Adjustable screen brightness and automatic brightness control with timeout after touch - Automatic brightness control via proximity sensing and change from fallback page to button display - Smooth dimming and color adjustment from 0.1%, easy spatial effects!

  • System lighting and lighting control
  • Spatial Design
  • Lighting Planning
  • Visualization

ブックマークに追加いたしました

ブックマーク一覧

ブックマークを削除いたしました

ブックマーク一覧

これ以上ブックマークできません

会員登録すると、ブックマークできる件数が増えて、ラベルをつけて整理することもできます

無料会員登録

Charcoal Shaving-kun

Total support for calculating, visualizing, and managing the CO2 emissions of your company's overall activities!

"Sumikaku-kun" is a service that allows for easy input of various usage data such as electricity and energy to calculate and visualize CO2 emissions. It enables the straightforward calculation of Scope 1 to 3 CO2 emissions for the entire supply chain, including business partners, through an easy-to-understand UI. Additionally, from the perspective unique to financial institutions, it provides one-stop support from the formulation of reduction plans to the provision of know-how for emission reductions and assistance with sustainable finance. 【Features】 ■ Easily calculate CO2 emissions for the entire supply chain ■ Total support from visualization to reduction as a uniquely developed service by financial institutions ■ Available at a low-cost burden *For more details, please download the PDF or feel free to contact us.

  • Analysis and prediction system
  • Visualization

ブックマークに追加いたしました

ブックマーク一覧

ブックマークを削除いたしました

ブックマーク一覧

これ以上ブックマークできません

会員登録すると、ブックマークできる件数が増えて、ラベルをつけて整理することもできます

無料会員登録

[Book] Visualization of the Five Senses and Cognitive Functions Using AI (No2110BOD)

Technical Reference Book: Specific Examples from Data Collection to Learning and Applications in Product Development

Book Title: Visualization of the Five Senses and Elucidation of Mechanisms Using Artificial Intelligence --- ◎ How can we "digitalize" intangible sensory information such as human preferences, sensitivities, actions, and tacit knowledge? ◎ Model human senses and apply them to product development! --- ■ Key Points of This Book 1. Smell, Taste, Sight, Touch, Hearing— Modeling of Human "Five Senses" and Product Development Using Artificial Intelligence 2. Modeling and Evaluation of Human "Emotions" and "Cognitive Functions/Actions" 3. Biometric Information Collection Techniques for Evaluating the Five Senses and Emotions and Their Analysis Through Machine Learning 4. Machine Learning Analysis of Time-Varying "Sensitivity/Sensory Data"

  • others
  • Visualization

ブックマークに追加いたしました

ブックマーク一覧

ブックマークを削除いたしました

ブックマーク一覧

これ以上ブックマークできません

会員登録すると、ブックマークできる件数が増えて、ラベルをつけて整理することもできます

無料会員登録

Real-time visualization of on-site actual inventory 'Smartmat Cloud'

Just by placing the products, you eliminate the hassle of inventory management.

"Smartmat Cloud" is a versatile inventory management automation IoT device that can be used for a wide variety of products and locations. It detects the weight of inventory and saves the remaining quantity to Smartmat Cloud. Using a simple mechanism, it allows for automatic recording and verification of actual inventory from the management screen. It automates not only inventory management and stocktaking but also the ordering process through an automatic ordering system. Smartmat Cloud is being adopted in various industries and settings. Dedicated inventory management professionals support the implementation, and over 800 companies have improved their operations through inventory and ordering automation. [Recommended for companies that] ■ Want to automate stocktaking and ordering to focus on important tasks ■ Want to visualize inventory management and understand optimal stock levels ■ Want to eliminate ordering mistakes, over-ordering, and missed orders *For more details, please refer to the PDF materials or feel free to contact us.

  • Logistics and warehouse management systems
  • Inventory Management System
  • Visualization

ブックマークに追加いたしました

ブックマーク一覧

ブックマークを削除いたしました

ブックマーク一覧

これ以上ブックマークできません

会員登録すると、ブックマークできる件数が増えて、ラベルをつけて整理することもできます

無料会員登録

Real-time visualization of actual inventory on-site 'Smartmat Cloud'

Just place it under the inventory, and everything from management to ordering is complete! Achieving new inventory management with IoT × SaaS.

"Smartmat Cloud" is an IoT device that automatically measures the weight of items subject to inventory management on a regular basis and accumulates information in the cloud, visualizing "inventory and consumption data." It is ideal for consumables with daily inventory flow, small items that cannot have barcodes or IC tags attached, and items that require weight management. In tasks such as inventory management, stocktaking, and ordering, which are prone to human error, it significantly reduces the workload of employees and enables efficient inventory management and ordering, achieving automation in inventory management tasks. ◆ Recommended for those with the following concerns: - Want to constantly grasp the quantity and fluctuations of inventory - Want to quickly respond to sudden inventory changes - Want to minimize the hassle of inventory management to the utmost - Want to manage the count of small parts like screws or manage the weight of powdered and liquid raw materials - Want to utilize consumption data to further implement digital transformation (DX)

  • Inventory Management System
  • Logistics and warehouse management systems
  • Order management system
  • Visualization

ブックマークに追加いたしました

ブックマーク一覧

ブックマークを削除いたしました

ブックマーク一覧

これ以上ブックマークできません

会員登録すると、ブックマークできる件数が増えて、ラベルをつけて整理することもできます

無料会員登録

Business Process Analysis: Practical Course on Business Process Analysis Methods

Usable! Business Process Analysis

The increasingly important business process analysis skills of information system personnel.

  • Consulting companies
  • Other Management Services
  • Other Software
  • Visualization

ブックマークに追加いたしました

ブックマーク一覧

ブックマークを削除いたしました

ブックマーク一覧

これ以上ブックマークできません

会員登録すると、ブックマークできる件数が増えて、ラベルをつけて整理することもできます

無料会員登録

Real-time recording and visualization of people and things - 'MANICA Tracer'

Achieving ultimate visualization with RFID!

MANICA Tracer is a real-time location management package that uses RFID. It enables real-time tracking of a large number of items and people within factories and warehouses.

  • Other Software
  • Other commercial buildings and service facilities
  • Visualization

ブックマークに追加いたしました

ブックマーク一覧

ブックマークを削除いたしました

ブックマーク一覧

これ以上ブックマークできません

会員登録すると、ブックマークできる件数が増えて、ラベルをつけて整理することもできます

無料会員登録

Restoration work for warehouse and factory floors, visualizing the current condition through floor surveys [AGV compatible].

Visualize floor irregularities with a dedicated profiler. We will quantify the hidden issues in the floor and propose high-productivity construction that anticipates the introduction of AGVs.

Restoration work can propose appropriate construction without excess or deficiency by conducting a floor survey using a profiler in advance. The survey organizes the locations and repair ranges of unevenness, steps, defects, cracks, puddles, and dirt. We will submit the survey report and propose the optimal construction. 1. Floor repairs (cracks, peeling, anchor marks) 2. Unevenness adjustment and polishing 3. Floor repainting (from removing existing floor paint to new painting) 4. Self-leveling work 5. Powerful cleaning (tire marks, tape marks, battery oil, etc.) We will provide an estimate by combining only the necessary items from the above. We can handle partial repairs to full surface repairs, and phased construction during nights and holidays is also possible. Based on your requests (finishing feel, operating conditions, construction period, budget), we will present a feasible process plan and alternative proposals (VE proposals). We can respond nationwide, starting from small areas. Please share the current condition photos and drawings first. We can also plan and estimate for AGV compatibility simultaneously.

  • Logistics and warehouse management systems
  • Visualization

ブックマークに追加いたしました

ブックマーク一覧

ブックマークを削除いたしました

ブックマーク一覧

これ以上ブックマークできません

会員登録すると、ブックマークできる件数が増えて、ラベルをつけて整理することもできます

無料会員登録

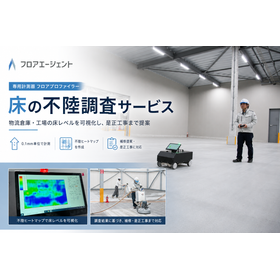
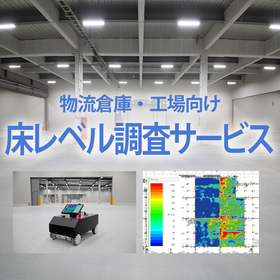
Floor irregularity inspection service | Visualizing the overall level, irregularities, and undulations of the floor.

Measure the floor level in 0.1mm increments and visualize it with an unevenness heat map and cross-sectional graph! We also provide corrective proposals before AGV implementation and warehouse renovations.

The Floor Unevenness Survey Service is a new survey service that visualizes the height differences, undulations, and steps that occur on concrete floors in logistics warehouses and factories using numerical data and diagrams. Even floors that appear flat can have slight unevenness that may affect driving stability and equipment planning when introducing AGVs or AMRs and advancing automation in warehouses. Floor Agent uses a dedicated measuring device, the Floor Profiler, to measure floor levels with an accuracy of 0.1mm. The collected data can be organized into an unevenness heat map, cross-sectional graphs, a list of measurement results, and repair proposal diagrams, allowing for a quick overview of the high and low areas and the trends of undulations across the entire floor. Furthermore, the service does not end with the survey; as a specialized contractor for concrete floors, we can also propose corrective construction based on the results. For high areas, we recommend unevenness adjustment grinding; for low areas or extensive bumps, we suggest self-leveling; and for joints and steps, we propose the installation of floor bridges, selecting the necessary methods for the required areas. We can make proposals that consider the flow and processes of operating warehouses while avoiding excessive construction. If you are considering checking the floor before introducing AGVs, renovating existing warehouses, or confirming floor precision for automation, please visit the Floor Agent website.

  • KS2_3459 のコピー_R.jpg
  • ChatGPT Image 2026年6月3日 15_19_37.png
  • Surveying Office
  • Other analytical equipment
  • Surveying
  • Visualization

ブックマークに追加いたしました

ブックマーク一覧

ブックマークを削除いたしました

ブックマーク一覧

これ以上ブックマークできません

会員登録すると、ブックマークできる件数が増えて、ラベルをつけて整理することもできます

無料会員登録

Floor Level Survey | Visualizing Floor Issues Before Introducing Robots in Warehouses and Factories

Before introducing AGVs, AMRs, and high-rise racks, we measure the floor's unevenness, undulations, irregularities, groove widths, and the condition of joint areas all at once. We can provide the report in as little as one day!

The floor accuracy survey service is designed to investigate whether the floor meets the running conditions for automated guided vehicles (AGVs, AMRs) in logistics warehouses and factories. Using a dedicated floor measuring device called a floor profiler, we measure the floor's unevenness, undulations, irregularities, groove widths, and the condition of joint areas all at once, visualizing the results in graphs and numerical data. After the measurement, we provide a floor report that includes: 01. Unevenness heat map 02. Detailed floor level sheet 03. Cross-sectional diagram of measurement lines These can serve as reference materials when considering floor renovations, as well as sales materials for tenants. According to JASS-5, the standard for floor level is ±7mm within 3 meters, but our floor accuracy survey service can measure with even higher precision standards. We can conduct surveys for both new and existing buildings, and we also accommodate measurements for transport pathways only. Additionally, if floor corrections are needed after the survey, we can handle various repairs such as step elimination work, unevenness correction work, and floor repair work according to the condition of the floor, so you can trust us to manage the entire process. Surveys can be conducted nationwide, so please contact Floor Agent for more information.

  • 床精度調査.png
  • ChatGPT Image 2026年7月21日 17_01_35 のコピー2.png
  • ChatGPT Image 2026年7月21日 17_01_35 のコピー.png
  • Automated guided vehicles (AGV, RGV)
  • Automated warehouse (AS, RS)
  • Other measuring instruments
  • Visualization

ブックマークに追加いたしました

ブックマーク一覧

ブックマークを削除いたしました

ブックマーク一覧

これ以上ブックマークできません

会員登録すると、ブックマークできる件数が増えて、ラベルをつけて整理することもできます

無料会員登録

Smart Factory Visualization Service

Supporting the smart factory transformation of the manufacturing industry! You can easily start small.

The "Smart Factory Visualization Service" sends and accumulates control device data and information from equipment and machinery in manufacturing sites, such as factories, to the cloud, enabling data visualization through graphs. It allows for monitoring the operational status of equipment via remote access from distant locations and facilitates remote maintenance of equipment, supporting the transformation of manufacturing sites into smart factories through the utilization of IoT. 【Features】 ■ Easy visualization of on-site data ■ Enables remote maintenance ■ Allows for gradual and reasonable usage ■ Supports the smart factory transformation in manufacturing *For more details, please refer to the PDF materials or feel free to contact us.

ブックマークに追加いたしました

ブックマーク一覧

ブックマークを削除いたしました

ブックマーク一覧

これ以上ブックマークできません

会員登録すると、ブックマークできる件数が増えて、ラベルをつけて整理することもできます

無料会員登録

Body Water Meter [Hydro Balance Meter] | Non-invasive visualization of dehydration risk

New Release: Body Water Meter - Measures body water content non-invasively. For dehydration and heatstroke prevention.

The body water meter is a medical device that non-invasively measures the amount of water in the body, allowing for the assessment of dehydration and heatstroke risk in a short amount of time. Under the guidance of healthcare professionals, it is used as an indicator of body water management in facilities for the elderly, medical institutions, sports settings, construction sites, and more, making it easy to understand the state of body water. In recent years, it has been expected to be utilized in research and clinical settings as a new evaluation tool that quantifies hydration status, particularly in addressing the issues of dehydration in the elderly and heatstroke prevention in sports environments. *As it is a general medical device, for detailed product information, please visit our official page via the related link below.*

  • Other measuring instruments
  • Visualization

ブックマークに追加いたしました

ブックマーク一覧

ブックマークを削除いたしました

ブックマーク一覧

これ以上ブックマークできません

会員登録すると、ブックマークできる件数が増えて、ラベルをつけて整理することもできます

無料会員登録

Visualizationに関連する検索キーワード