Seminar in Tokyo on 12/9: Utilizing Data for Quality Improvement
Statistical analysis software JMP

Solving issues such as 'missing signs of abnormalities' and 'being unable to identify the cause when problems occur'!
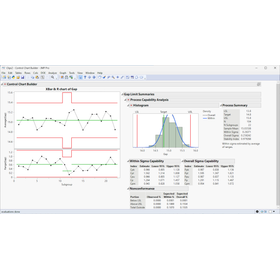
This is a free in-person seminar in Tokyo for manufacturing industry engineers, using the statistical analysis software JMP. In this seminar, we will cover practical methods for quality control and factor analysis, introducing a data-driven approach to problem-solving. We will explain analytical approaches that can be utilized in manufacturing settings, from monitoring quality to investigating causes when problems arise, with demonstrations included. 【Target Audience】 - Quality control personnel in the manufacturing industry - Production technology and process improvement personnel - Those who want to utilize process and quality data - Those who feel challenged by factor analysis when problems occur 【What You Will Learn in This Seminar】 - How to monitor process and quality anomalies - In what situations control charts can be utilized - Methods for identifying key factors among numerous process variables - Thinking strategies to narrow down causes based on data ▼Details & Registration https://www.jmp.com/ja/events/seminars/discovery-seminar-series/2026/12-09
Inquire About This Product
basic information
Date and Time: December 9, 2026 (Wednesday) 14:00 - 16:00 Venue: TKP Ichigaya Conference Center 2-minute walk from JR Sobu Line Ichigaya Station 1-minute walk from Tokyo Metro Ichigaya Station Exit 7 Overview: 1) Taking Quality Control to the Next Level - Utilizing JMP Beyond Control Charts - In quality control, it is important not only to monitor processes through control charts and process capability analysis but also to identify causes during abnormal occurrences and share information with stakeholders. However, there are many cases in the field where analysis results are not sufficiently utilized or shared. This session will introduce the flow from control charts and process capability analysis to cause exploration, and how to share the created analysis results within the organization using JMP Live. 2) Data-Driven Cause Analysis and Quality Improvement When issues related to quality or yield decline occur, quickly identifying the cause is not easy. This session will explain examples of analytical approaches to efficiently narrow down the causes of problems using process and quality data, from detecting anomalies using multivariate control charts to exploring causes through visualization and multivariate analysis, demonstrating how to advance data analysis for quality improvement.
Price information
Free (Pre-registration is required from the page below) https://www.jmp.com/ja/events/seminars/discovery-seminar-series/2026/12-09 Capacity: 40 people (first come, first served)
Delivery Time
※After your application, we will process it on a first-come, first-served basis and send you a confirmation email. One week before the event date, we will send you a ticket email containing information on how to enter.
Applications/Examples of results
"Democratization of Data" and Sharing the "Wisdom" of Manufacturing Across the Company - TOTO's New Exploration of "Good Products and Homogeneity" [Challenge] The manufacturing of sanitary ceramics using natural materials involves approximately 13% shrinkage during the drying and firing processes. As products become larger and more complex, the challenge is how to maintain "homogeneous" high quality and transform the "tacit knowledge" of skilled artisans into "explicit knowledge" to pass on to the next generation. This has been a crucial issue at TOTO Ltd., which has a history of over 100 years and forms the core of the company's manufacturing. [Solution] We introduced "exploratory data analysis" using JMP on the manufacturing data from our advanced Shiga factory. By implementing the first barcode system in the sanitary ceramics factory, we deepened the high yield achieved and quantified the "good product conditions" using visual verification with graph builders, as well as partitioning and cluster analysis, leading to improvements in direct delivery rates and yield. Additionally, we adopted JMP for the foundational education of our "in-house study abroad program" over two years, aiming to enhance company-wide data science skills. [Result] Please check the following page for more details! https://www.jmp.com/ja/customer-stories/toto
catalog(1)
Download All Catalogs
Company information

The JMP story goes back to 1989 when John Sall decided to combine statistical analysis capabilities with graphical visualizations to animate and visualize data. For more than 35 years now, John Sall has led JMP R&D, making each version of JMP more visual, more interactive, and more practical to help users understand their data. What started as a passion project has grown by leaps and bounds. It’s now a family of statistical software products designed with scientists and engineers in mind and used worldwide in nearly every industry.