Utilization Techniques of "Graph Builder" for Research, Development, and Design

From creating commonly used graphs to new discoveries (Online seminar held on 10/29)
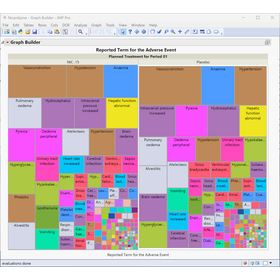
Aren't you just using the data obtained from experiments and prototypes to create figures for your reports? In this seminar, we will confirm the features and basic operations of JMP's Graph Builder, and using data typically acquired in research, development, and design departments as examples, we will create commonly used graphs such as mean values with error bars, box plots, and scatter plots with regression lines. Furthermore, we will demonstrate how to utilize features that are difficult to achieve with spreadsheets like Microsoft Excel, such as group splitting, local data filters, and column switchers, to facilitate new discoveries by switching conditions. We will also explain the steps for customizing graphs and producing high-quality outputs. The content is designed to be understandable even for those who have never used JMP or are beginners. Details & Registration https://www.jmp.com/ja/events/live-webinars/non-series/2026/10-29-graph-builder
Inquire About This Product
basic information
Date and Time: October 29, 2026 (Thursday) 14:00 - 15:00 Target Participants: - Engineers who regularly handle experimental data or prototype data in research, development, design, and production technology. - Those who currently create graphs using Excel and feel challenged by the effort required for conditional comparisons and plotting. Main Content: - Features and basic operations of the graph builder. - How to create commonly used graphs in research, development, and design departments. - Utilizing features that encourage new discoveries, which are difficult to achieve with spreadsheets. - Customization of graphs and high-quality output.
Price information
Free participation (pre-registration is required from the page below) https://www.jmp.com/ja/events/live-webinars/non-series/2026/10-29-graph-builder
Delivery Time
Applications/Examples of results
"Democratization of Data" and Sharing the "Wisdom" of Manufacturing Across the Company - TOTO's New Exploration of "Good Products and Uniformity" [Challenge] The manufacturing of sanitary ceramics using natural raw materials involves approximately 13% shrinkage during the drying and firing processes. As products become larger and more complex, the challenge is how to maintain "uniform" high quality and transform the "tacit knowledge" of skilled artisans into "explicit knowledge" to pass on to the next generation. This has been a crucial issue at TOTO Ltd., which has a history of over 100 years and is fundamental to the company's manufacturing. [Solution] Exploratory data analysis using JMP was introduced for the manufacturing data from the advanced Shiga factory. By deepening the high yield achieved through the introduction of the first barcode system in the sanitary ceramics factory, the "good product conditions" were quantified using visual verification with graph builders, as well as partitioning and cluster analysis, leading to improvements in direct delivery rates and yield. Additionally, JMP was adopted for the foundational education of the two-year "in-house study abroad program," aiming to enhance data science skills across the company. [Result] Please check the following page for details! https://www.jmp.com/ja/customer-stories/toto
catalog(3)
Download All Catalogs


Company information

The JMP story goes back to 1989 when John Sall decided to combine statistical analysis capabilities with graphical visualizations to animate and visualize data. For more than 35 years now, John Sall has led JMP R&D, making each version of JMP more visual, more interactive, and more practical to help users understand their data. What started as a passion project has grown by leaps and bounds. It’s now a family of statistical software products designed with scientists and engineers in mind and used worldwide in nearly every industry.