
JMP is not just for analysis! Ways to utilize data processing, automation, and visualization.

Doesn't it bother you that 'data processing takes time,' 'you are repeating the same tasks every time,' and 'creating graphs is surprisingly difficult'?
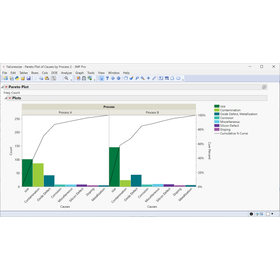
As the importance of data utilization increases, a significant amount of time is spent on tasks such as data processing and graph creation. Particularly in spreadsheet software, errors due to repetitive manual work are often a challenge. JMP not only offers advanced statistical analysis but also has a wealth of features for data preprocessing and visualization. In this seminar, we will introduce methods to streamline data operations, from data loading and processing to graph creation and automation. 【Target Audience】 - Individuals across various industries who regularly process and graph data using spreadsheet software. - Those who find the monthly or weekly report and graph creation cumbersome. - Individuals who want to streamline data preparation tasks and spend more time on analysis and reporting. - Those interested in learning how to utilize JMP not only for analysis but also for data preprocessing and visualization. 【Main Content】 - Loading various tabular data formats - Streamlining data processing and formatting - Automating routine tasks - Creating expressive graphs * Content is subject to change. * This will be a format where you can watch the instructor's explanations and demonstrations.
Inquire About This Product
basic information
Date and Time: October 8, 2026 (Thursday) 14:00 - 15:00 (Online seminar using Zoom)
Price information
Participation is free, but prior registration is required from the page below.
Delivery Time
Applications/Examples of results
"Democratization of Data" - Sharing the "Wisdom" of Manufacturing Across the Company: TOTO's New Exploration of "Good Products and Uniformity" [Challenge] The manufacturing of sanitary ceramics using natural raw materials involves approximately 13% shrinkage during the drying and firing processes. As products become larger and more complex, the challenge is how to maintain "uniform" high quality and convert the "tacit knowledge" of skilled artisans into "explicit knowledge" to pass on to the next generation. This has been a crucial issue at TOTO Ltd., which has a history of over 100 years and is fundamental to the company's manufacturing. [Solution] An "exploratory data analysis" using JMP was introduced for the manufacturing data from the advanced Shiga factory. By deepening the high yield achieved through the introduction of the first barcode system in the sanitary ceramics factory, the "good product conditions" were quantified using visual verification with graph builders, as well as partitioning and cluster analysis, leading to improvements in direct rates and yield. Additionally, JMP was adopted for the foundational education of the "in-house study abroad program" over two years, aiming to enhance company-wide data science skills. [Result] Please check the following page for more details! https://www.jmp.com/ja/customer-stories/toto
catalog(2)
Download All Catalogs
Company information

The JMP story goes back to 1989 when John Sall decided to combine statistical analysis capabilities with graphical visualizations to animate and visualize data. For more than 35 years now, John Sall has led JMP R&D, making each version of JMP more visual, more interactive, and more practical to help users understand their data. What started as a passion project has grown by leaps and bounds. It’s now a family of statistical software products designed with scientists and engineers in mind and used worldwide in nearly every industry.