Search for products by classification category
Search for companies by industry
Added to bookmarks
Bookmark has been removed
You can't add any more bookmarks
By registering as a member, you can increase the number of bookmarks you can save and organize them with labels.
1~45 item / All 82 items
The electromagnetic field analysis software "PHOTO-Series" is a simulation tool that can visualize magnetic field distributions and eddy current density distributions. Based on the governing equations of electromagnetic phenomena, the "Maxwell equations," it visualizes the strength and direction of electromagnetic fields. It can cover a wide range of areas, from low-frequency electric field analysis to high-frequency electromagnetic field analysis such as radio waves. One of the non-destructive testing methods for detecting defects, the eddy current deep flaw method, is also included in the analysis targets. ★ We will conduct a demo version giveaway campaign. <Campaign Period> November 1, 2023 (Wednesday) to January 31, 2024 (Wednesday) <Demo Version Overview> ◎ You can try the program without any time restrictions. ◎ All functions except for the number of elements (or nodes) limit are the same as the product version. <Target Audience> ◎ Those considering purchasing the product. ◎ Those who want to actually try out the software. ◎ Those who want to confirm the operational feel or practice the operation. This is a campaign that has been conducted in the past and received positive feedback. If you are interested, please contact us via the "Contact Us" button below.
Electromagnetic field analysis was conducted to determine the resonant frequency and resonant modes of a cavity resonator. In this case, a rectangular cavity resonator was modeled for eigenvalue analysis, and the resonant frequency and resonant modes (patterns of electric and magnetic fields) were obtained. 【Case Overview】 ■ Software Used: PHOTO-WAVEjω ■ Analysis Results ・In Mode 1, the error compared to the theoretical value was only 0.104%.
This is an example of heating an entire cylindrical conductor by moving it and using induction heating. By passing through the center of a coil connected to an AC power source, eddy currents flow on the surface of the conductor, generating heat. The temperature rises from the surface, and heat is conducted inward. Due to the axisymmetric shape of this model, it can be analyzed using 2D axisymmetric analysis. Therefore, plate elements are used. To understand the heat generation distribution and temperature distribution inside the cylindrical conductor, a magneto-thermal coupled analysis using the finite element method is effective. [Case Overview] ■ Analysis Module: PHOTO - EDDYjω & THERMO *For more details, please refer to the related links or feel free to contact us.
Using the heat generation density obtained from magnetic field analysis, thermal conduction analysis will be conducted, resulting in a temperature distribution. This is an example of magnetic field-thermal coupled analysis using temperature-dependent electrical conductivity. The heated object is a metal filled in a crucible. An alternating current flows through the coil, and the metal is heated by the eddy currents flowing through it. In induction heating analysis, the temperature distribution varies depending on the elapsed time and the location of the analysis target. When the electrical conductivity has temperature-dependent characteristics, the distribution of electrical conductivity changes by location, necessitating a close coupled analysis of the magnetic field and heat. [Case Overview] ■ Analysis Type: Axisymmetric Analysis ■ Analysis Module: PHOTO - EDDYjω & THERMO ■ Coil: Current Density Vector ■ Frequency: 3[kHz] ■ Conductor: Temperature Dependence of Electrical Conductivity *For more details, please refer to the related links or feel free to contact us.
Copiers and printers utilize electrophotographic technology. In the electrophotographic process, the steps of "charging," "exposure," "developing," "transferring," and "fixing" are carried out, followed by paper ejection. Fixing is the process of solidifying the toner on the paper using heat and pressure. In fixing, energy efficiency and reduced warm-up time are required, and IH technology is used as a heating method. In this case, the heat generation density distribution obtained through magnetic field analysis is used in thermal conduction analysis to analyze the temperature distribution of the roller. The positions of the magnetic core and coil are fixed, and the analysis takes into account the rotation of the roller. For more details, please refer to the related links below. 【Case Overview】 ■ Analysis Type: 3D Analysis ■ Analysis Module: PHOTO - EDDYjω & THERMO *For more details, please refer to the related links or feel free to contact us.
A piezoelectric material is a dielectric that converts mechanical force into electricity or electricity into mechanical force. In this case, a force is applied to the upper surface of a cylindrical piezoelectric material, and the resulting voltage is analyzed. Since the equations related to "force" and "electricity" are different, these equations are coupled to analyze the piezoelectric element. Therefore, a coupled analysis of stress and electric field was conducted. The software used for stress analysis and electric field analysis is PHOTO-ELAS and PHOTO-VOLT, respectively. 【Case Overview】 ■ Software Used: PHOTO-ELAS and PHOTO-VOLT ■ Analysis Conditions - Relative Permittivity: 2000 - Young's Modulus: 5×10^10 - Poisson's Ratio: 0.35 - Analysis Modules: VOLT & ELAS *For more details, please refer to the related links or feel free to contact us.
We will introduce an analysis case that focuses on the boundary conditions used in thermal conduction analysis, comparing theoretical solutions with simulation results. The thermal conduction analysis software "PHOTO-THERMO" can be used not only for coupled analysis using heat generation density obtained from electromagnetic field analysis but also independently. In this case, we used a circular pipe model as shown in the left figure. We conducted thermal conduction analysis under three conditions: "constant temperature boundary condition," "heat generation density," and "heat transfer boundary condition." Since theoretical solutions can be obtained for all of these, you can evaluate the validity of the program by comparing the analysis results. [Case Overview] ■ Conditions for Thermal Conduction Analysis - Constant temperature boundary condition - Heat generation density - Heat transfer boundary condition *For more details, please refer to the related links or feel free to contact us.
In this analysis case, we will introduce a comparison between the calculated values of the capacitance of a cylindrical capacitor and the theoretical solutions. The analysis covers three conditions: "Cylindrical Capacitor (Air)," "Cylindrical Capacitor (Dielectric - Radial Two Layers)," and "Cylindrical Capacitor (Dielectric - Circumferential Two Layers)." Since this case involves electrostatic field analysis, it can be analyzed not only in VOLT but also in VOLTjω. For more details, please refer to the related links below. 【Case Overview】 ■ Software Used: PHOTO-VOLT or VOLTjω ■ Analysis Results - Cylindrical Capacitor (Air): 5.039E-11 - Cylindrical Capacitor (Dielectric - Radial Two Layers): 3.681E-10 - Cylindrical Capacitor (Dielectric - Circumferential Two Layers): 3.780E-10 *For more details, please refer to the related links or feel free to contact us.
When a high voltage is applied to a coil, as in the case of surge voltage, a locally high electric field is generated, leading to discharge and damage to the coil's insulation. In this case, we analyze the electric field generated when a voltage is applied between insulated coil wires (cables). The electric field strength is defined per voltage of 1[V] between the coil wires, and by multiplying this by the actual applied voltage, it can be considered as the maximum electric field strength. Please feel free to consult us regarding any concerns about electromagnetic field analysis. 【Case Overview】 ■ Software Used: PHOTO-VOLT *For more details, please refer to the related links or feel free to contact us.
Here is an example of electric field analysis for a comb-type electrostatic actuator. Electrostatic actuators generate electrostatic force based on the sign of the charges present on opposing electrodes, so electric field analysis is applied. In "PHOTO-VOLT," it is possible to calculate the potential distribution, electric field distribution, and the electrostatic force acting on the electrodes. Additionally, we consider whether the order of the electrostatic force obtained from the analysis results is reasonable. For more details, please refer to the related links below. 【Case Overview】 ■ Software Used: PHOTO-VOLT ■ Analysis Results ・Electrostatic Force (per unit length): 0.792[N] *For more details, please refer to the related links or feel free to contact us.
Here is an example of nonlinear electric field analysis for cable joints. The electric field analysis software "PHOTO-VOLT" and "VOLTjω" can be selected from two modes: electric field analysis and current distribution analysis. This case uses current distribution analysis. In the electrical insulation design of direct current power cable joints, it is necessary to consider the nonlinear conductivity characteristics of the insulating material. For detailed analysis results, please refer to the related links below. [Case Overview] ■ Software Used: PHOTO-VOLT or VOLTjω * For more details, please refer to the related links or feel free to contact us.
There is a capacitive proximity switch that can detect both metal and non-metal objects without contact. This sensor detects objects by converting changes in capacitance into electrical signals. In this case study, we will analyze the capacitance between a grounded detection body (metal) and the electrodes within the sensor. We will also observe the changes in capacitance when the relative position of the electrodes is altered from the perspective of the detection body. 【Case Overview】 ■ Software Used: PHOTO-VOLT or VOLTjω ■ Analysis Type: 3D Electric Field Analysis *For more details, please refer to the related links or feel free to contact us.
The wound-type capacitor has a structure where electrode foils and dielectrics are alternately layered and rolled up, featuring a compact design while increasing the area of the electrodes. In "PHOTO-VOLTBM," there is no need for air mesh, allowing for the easy creation of complex-shaped models in conjunction with programmatic mesh deformation. In this case study, we will perform an electric field analysis of the wound-type capacitor. Additionally, we will compare the capacitance obtained from the analysis with theoretical values. For detailed information on the analysis conditions and results, please refer to the related links below. [Case Overview] ■ Analysis Module: PHOTO-VOLTBM *For more details, please check the related links or feel free to contact us.
The analysis of the magnetic field created by magnets and coils is referred to as a forward problem. On the other hand, the problem of determining magnetization or current from the magnetic field distribution is called an inverse problem. In this case, we will introduce an example (inverse problem) where we estimate the magnetization inside a magnet from numerical data of the magnetic flux density on the surface of a plastic magnet and analyze the magnetic flux density created by that magnetization. For convenience, we will estimate the magnetization from the magnetic flux density obtained through the forward problem and calculate the magnetic flux density at a different location. Since we will use the results of the forward problem, we can compare the results of the forward and inverse problem analyses to evaluate the validity of the inverse problem's analytical function. 【Case Overview】 ■ Software Used: PHOTO-MAGTZ ■ Analysis Results - The magnetic flux density at a position 1mm away from the surface of the magnet is generally consistent between the forward and inverse problems. - There are multiple magnetization distributions that indicate the same magnetic flux density. *For more details, please refer to the PDF document or feel free to contact us.
The "hysteresis model using free energy" developed by our company incorporates the free energy of magnetic materials and the movement of magnetic walls obtained through thermodynamic considerations as a friction model. It is based on physical principles rather than a mathematical model. The ICCG method and the Newton-Raphson method can be directly utilized, improving the expressiveness of hysteresis curves, including minor loops, and enabling vectorization (magnetic anisotropy). In the calculation examples using this method, we will verify whether hysteresis curves that can be expressed mathematically can be reproduced through simulation. We focused on analyzing a single component. If you are interested in magnetic field analysis considering hysteresis, please feel free to contact us. 【Case Overview】 ■ Software Used: PHOTO-MAG *For more details, please refer to the PDF document or feel free to contact us.
We will introduce a case study of magnetic field analysis for magnetic shielding. A coil is placed outside the shield, and the internal magnetic field is calculated. The analysis model uses the "Box shield model" proposed by the Electrical Engineering Society's Investigation Committee. The coil used is an external field coil, and the analysis model is set as a 1/8 model due to symmetry. The analysis type is nonlinear static magnetic field analysis. Eddy currents are not considered. We have included diagrams of the B-H characteristics of the ss400 used in this study, so please refer to the related links below for more details. 【Case Overview】 ■ Analysis Model: Box shield model ■ Analysis Type: Nonlinear static magnetic field analysis ■ Software Used: PHOTO-MAG *For more details, please refer to the related links or feel free to contact us.
IPM motors have a structure in which magnets are embedded in the rotor, allowing for the utilization of both magnetic torque and reluctance torque, making them widely used as high-efficiency motors. In this analysis, we examined the induced voltage in an unloaded state and the torque waveform under load conditions. The magnets are input with a magnetization vector, and the coil current is input as current density. The current density is set with a time point sequence of a three-phase AC waveform. By setting the rotational speed at the nodes that make up the rotor, we take rotation into account. 【Case Overview】 ■ Analysis Type: 2D Nonlinear Magnetic Field Analysis ■ Software Used: PHOTO-MAG *For more details, please refer to the related links or feel free to contact us.
Using the hysteresis analysis function, we conducted magnetization analysis of magnets with high coercivity. A cylindrical magnet was magnetized using a coil. The current was increased from 0[A] to a maximum value and then returned to 0[A]. We analyzed the magnetic field in the space at that time. The hysteresis analysis function uses "hyperbolic function approximation" to represent the hysteresis loop in this case. The hyperbolic function approximation takes coercivity, remanent magnetization, and saturation magnetization as input values, and these values determine the hysteresis loop using a hyperbolic function. [Case Overview] ■ Software Used: PHOTO-MAG ■ Analysis Type: 3D Nonlinear Magnetic Field Analysis (1/4 model due to shape symmetry) *For more details, please refer to the related links or feel free to contact us.
In this case study, we will introduce static magnetic field analysis of various models. "PHOTO-MAGTZ" does not require an air mesh. Therefore, it is easy to create models with complex shapes. Additionally, by inputting the current value into the coil, it is possible to simplify the input of current density for coils with complex shapes. You can view the analysis results from the related links below. 【Case Overview】 ■Analysis Module: PHOTO-MAGTZ *For more details, please refer to the related links or feel free to contact us.
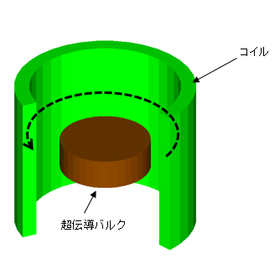
Models used to describe superconductors include the critical state model and the Kim model. The critical state model is a physical model that assumes a balance between the Lorentz force acting on the vortices and the pinning force caused by impurities within the superconductor. In "PHOTO-EDDY," users can specify the constitutive equations, allowing for the analysis of not only a constant Jc but also models like the Kim model, where Jc depends on magnetic flux density. The choice of which equations to use is up to the user. While care must be taken regarding the convergence of calculations, a high degree of freedom in input methods is available. [Case Overview] ■ Software Used: PHOTO-EDDY ■ Analysis Results - The superconductor was modeled using the critical state model, with a critical current density Jc set at 1.0×10^9 [A/m²]. - The input current was adjusted so that the magnetic flux density at the center of the coil reached a maximum of 5 [T] when in the air-core condition. *For more details, please refer to the PDF document or feel free to contact us.
In recent years, research and development have been conducted on wireless power transmission technology that transmits power wirelessly. First, as a basic model, we consider two coils as shown in the left diagram. The transmitting coil and receiving coil are arranged vertically, and circuit elements are connected to the coils. On our company's website, we introduce analysis examples of wireless power transmission using electromagnetic induction. For more details, please refer to the related links below. 【Case Overview】 ■ Software Used: PHOTO-EDDYjω ■ Analysis Results ・Self Inductance: 358.7 [uH] ・Mutual Inductance: 38.4 [uH] *For more details, please refer to the related links or feel free to contact us.
This is an example of analyzing the electromagnetic force (Lorentz force) acting on eddy currents. Using the software "PHOTO-EDDY," a 1/4 model was created based on the symmetry of the shape. As a result, it was confirmed that the input current becomes 0 at 1.5 [μsec], but the Lorentz force continues to occur beyond 1.5 [μsec]. 【Case Overview】 ■ Software Used: PHOTO-EDDY ■ Analysis Results - It was confirmed that the magnetic flux density is concentrated on the surface due to the skin effect. - The input current becomes 0 at 1.5 [μsec], but it was confirmed that the Lorentz force continues to occur beyond 1.5 [μsec]. *For more details, please refer to the related links or feel free to contact us.
This is a case study that confirms the current distribution observed when an alternating current is passed through a conductor bundled with 19 strands of wire, using magnetic field analysis. Since frequency response magnetic field analysis is appropriate, the software "PHOTO-EDDYjω" was selected. The input voltage was adjusted to ensure that the maximum value of the resulting current density (absolute value) is 1. As a result, at a frequency of 1×10^5 [Hz], the current density was almost constant, while at a frequency of 1×10^7 [Hz], a concentration of current density was observed on the surface of the outermost layer of the conductor. 【Case Summary】 ■ Software Used: PHOTO-EDDYjω ■ Analysis Results ・1×10^5 [Hz]: Almost constant ・1×10^6 [Hz]: Gradual distribution of current density observed ・1×10^7 [Hz]: Concentration of current density observed on the surface of the outermost layer of the conductor *For more details, please refer to the related links or feel free to contact us.
Here is an example of magnetic field analysis for magnetic shielding. The analysis model uses the "Box shield model" proposed by the Electric Society's Investigation Committee. The analysis model is based on symmetry and is a 1/8 model, with an external field coil used. Dynamic magnetic field analysis is applied, taking into account eddy currents. 【Case Summary】 ■ Analysis Model: Box shield model ■ Coil: External field coil ■ Analysis Type: Frequency response dynamic magnetic field analysis ■ Shielding: Linear material *For more details, please refer to the related links or feel free to contact us.
Induction machines that utilize electromagnetic induction are used in home appliances, escalators, and trains. Since eddy currents flow in induction machines, magnetic field analysis is necessary. The subject is a squirrel-cage three-phase induction motor, and considering the rotation of the rotor, the torque waveform during steady operation is analyzed. The analysis model was referenced from the benchmark model (K model) of induction motors by the Electrical Engineering Society's Investigation Committee. [Case Summary] ■ Analysis Type: 2D Nonlinear Transient Magnetic Field Analysis ■ Analysis Module: PHOTO-EDDY *For more details, please refer to the related links or feel free to contact us.
We will introduce a case where we analyzed the current flowing through the cable and the induced voltage and current values flowing through the secondary coil. The analysis model utilizes symmetry, using a 1/2 model, and a high permeability magnetic material is used for the core. The current sensor consists of a ring-shaped core and winding, with the measured current flowing through the cable at the center of the core, allowing us to obtain a small current flowing through the winding (secondary side). 【Case Overview】 ■ Software Used: PHOTO-EDDYjω ■ Analysis Conditions - Current value of the primary coil: 10[A] - Frequency: 50[Hz] - Number of turns in the secondary coil: 1000[turns] - Load resistance of the secondary coil: 100[Ω] *For more details, please refer to the related links or feel free to contact us.
We will introduce the analysis results using the finite element method (FEM) with coils and external field coils for the same analysis target. We adopted "Team Workshop Problem 7," which involves placing a coil on a perforated conductor. Since this problem has measurement values, we compared the results under three conditions: FEM, external field coil, and measurement values, and also conducted an analysis with the coil moved. The results from the external field and FEM overlapped in the graphs, and the comparison with the measurement values was also favorable. 【Case Overview】 ■ Software Used: PHOTO-EDDYjω ■ Analysis Conditions - Frequency: 200 [Hz] - Current Value: 2742 [AT] - Electrical Conductivity of Conductor: 3.526×10^7 [S/m] ■ Results from External Field and FEM: The graphs overlapped, and the comparison with measurement values was also favorable. *For more details, please refer to the related links or feel free to contact us.
This is an example of transient magnetic field analysis using the H method, where the current distribution of a superconducting tape was analyzed. The "n-value model" was used for the E-J characteristics of the superconducting tape. By using the magnetic field analysis module "PHOTO-EDDYTM," it is possible to analyze with a mesh of only the conductor, eliminating the need for an air mesh. 【Case Overview】 ■ Software Used: PHOTO-EDDYTM ■ Analysis Conditions - Current Value: 50[A] (maximum)… time-varying according to a function - Material Conditions: Relative permeability 1.0, electrical conductivity according to the program [S/m] - The "n-value model" was used for the E-J characteristics of the superconducting tape. *For more details, please refer to the related links or feel free to contact us.
We will introduce the analysis results of eddy current distribution, self-inductance, and mutual inductance. The analysis was conducted for three cases: only conductor 1, only conductor 2, and both conductors 1 and 2 carrying current. The mesh scale consists of 3,200 elements and 4,800 nodes. By using the magnetic field analysis module "PHOTO-EDDYTMjω," it is possible to perform the analysis with a mesh of only the conductors, eliminating the need for an air mesh. [Case Overview] ■ Software Used: PHOTO-EDDYTMjω ■ Analysis Conditions - Current Value: 1[A] - Material Properties: Relative Permeability 1.0, Electrical Conductivity 1.0×10^6[S/m] - Frequency: 1.0[kHz] *For more details, please refer to the related links or feel free to contact us.
We will introduce the analysis results of current distribution (real part and imaginary part) and self-inductance. The mesh scale consists of 11,200 elements and 15,088 nodes. By using the magnetic field analysis module "PHOTO-EDDYTMjω," it is possible to analyze with a mesh of only conductors, eliminating the need for an air mesh. 【Case Overview】 ■ Software Used: PHOTO-EDDYTMjω ■ Analysis Conditions ・Current Value: 1[A] ・Frequency: 1000[Hz] *For more details, please refer to the related links or feel free to contact us.
This is a case study of the magnetic flux density distribution, self-inductance, and mutual inductance analysis of a transformer composed of primary and secondary windings and a magnetic circuit (iron core) when excited. The software "PHOTO-EDDYTMjω" was used. A current of 1A at a frequency of 1000Hz was applied to the primary and secondary windings. Additionally, the number of nodes was 18,118, and the number of elements was 13,648, with the shape modeled as a three-dimensional full model. [Case Overview] ■ Software Used: PHOTO-EDDYTMjω ■ Analysis Conditions - Model using the iron core and primary and secondary windings - Applied a node current of 1A and 1000Hz to the primary and secondary windings *For more details, please refer to the related links or feel free to contact us.
When a magnet is brought close to a gear made of a magnetic material, the distribution of the surrounding magnetic field changes depending on the position and rotation speed of the gear. A permanent magnet was placed near the rotating gear to analyze the changes in the surrounding magnetic field. As a result, in the comparison of magnetic flux density due to rotation speed, the gear rotating at high speed exhibited a larger magnetic field along the edge of the gear, and a magnetic field due to eddy currents remained even when it was away from the magnet. [Case Summary] ■ Analysis Type: 3D Nonlinear Transient Magnetic Field Analysis ■ Analysis Module: PHOTO-EDDY *For more details, please refer to the related links or feel free to contact us.
On this page, we introduce electromagnetic wave analysis animations of waveguides such as "Magic T," "E-plane T-junction waveguide," and "twisted waveguide." 【Overview】 ■ Magic T ■ E-plane T-junction waveguide ■ Twisted waveguide ■ Circular cavity ■ Rectangular iris-coupled waveguide filter *For detailed information about the examples, please refer to the related links. For more information, feel free to contact us.
In "PHOTO-WAVEjω" prior to Ver8.0, it was necessary to set the electric field (3 components) at nodes or the current density (3 components) at elements as load conditions. Since Ver8.2, a feature has been added to automatically set these load conditions. Users can specify a set of nodes that are on the same plane, and by simply entering a few parameters, the program calculates the electric field at each node and sets it as the load condition. [Issues] ■ In "PHOTO-WAVEjω" prior to Ver8.0, it was necessary to set the electric field at nodes or the current density at elements as load conditions. ■ When setting the electric field in a rectangular waveguide, it was necessary to set each electric field component from the coordinate values of each node, which was a cumbersome task for users. *For more details, please refer to the related links or feel free to contact us.
Photonic crystals are structures that can control light by periodically arranging multiple dielectrics. Electromagnetic wave analysis was conducted using the finite element method. The optical waveguide consists of periodically arranged dielectric rods, and light passes through the areas without dielectric rods. The radius of the rods, r, and the period of the rods, a, are set as r = 0.18a, and the electric field component parallel to the dielectric rods was input. 【Case Overview】 ■ Software Used: PHOTO-WAVEjω ■ Analysis Conditions - The radius of the rods, r, and the period of the rods, a, are set as r = 0.18a (Wavelength λ: 1.55μm, Refractive index n: 3.4) - Impedance boundary conditions are set on the sides - The electric field component parallel to the dielectric rods was input *For more details, please refer to the related links or feel free to contact us.
We will introduce a case study analyzing the frequency dependence of the reflection rate by placing metal posts that suppress the reflection of electromagnetic waves at 10 GHz. Impedance boundary conditions were set at the exit. The walls of the waveguide and the metal posts were treated as perfect conductors, and the input was provided as the TE10 electric field [V/m]. Additionally, an analysis was conducted for the case without metal posts for comparison. 【Case Overview】 ■ Software Used: PHOTO-WAVEjω ■ Analysis Conditions - Waveguide: WRJ-10 (22.9mm × 10.2mm) - The walls of the waveguide and the metal posts are perfect conductors - The input was provided as the TE10 electric field [V/m] - Impedance boundary conditions were set at the exit *For more details, please refer to the related links or feel free to contact us.
This is an example of estimating the scattered wave in the far field when a plane wave is incident on a scattering body, using the finite element method. A plane wave polarized in the X-axis direction is incident in the Z-axis direction, and the scattered wave after it hits this sphere is analyzed using the finite element method. Next, based on those results, the scattered wave in the far field is estimated using two different methods, and the results are compared. The shape is modeled in full. 【Software Used】 ■PHOTO-WAVEjω *For more details, please refer to the related links or feel free to contact us.
The Yagi-Uda antenna is a directional antenna composed of a waveguide made up of multiple short elements, a long element reflector, and a feed mechanism positioned between them. The electromagnetic waves radiated from the feed mechanism are analyzed using the finite element method, and based on the results, far-field plane waves are estimated. The feed mechanism radiates electromagnetic waves polarized in the Z-axis direction, and the behavior of the electromagnetic waves in the air region surrounding the entire antenna is analyzed using the finite element method. Next, based on those results, the electromagnetic waves in the far field are estimated using two different methods, and the results are compared. The shape is modeled as a full model. [Software Used] ■ PHOTO-WAVEjω *For more details, please refer to the related links or feel free to contact us.
We will introduce a case study analyzing the input impedance of a dipole antenna using the electromagnetic wave analysis software "PHOTO-WAVEjω." The antenna has a diameter of 1mm, a length of 60.5mm, and a gap of 0.5mm. An impedance boundary was set at the model boundary. The antenna was treated as a perfect conductor. 【Case Overview】 ■ Software Used: PHOTO-WAVEjω ■ Analysis Conditions - An impedance boundary was set at the model boundary - The antenna was treated as a perfect conductor *For more details, please refer to the related links or feel free to contact us.
When a dielectric such as polyethylene is filled in a rectangular waveguide, electromagnetic wave reflection occurs at the boundary with air. Considering a system where polyethylene is filled in part of a rectangular waveguide of standard WRJ-5, the distribution of electromagnetic waves was analyzed using the finite element method. As a result, it was found that the absolute value of the electric field on the polyethylene side is constant, indicating that there is no reflection at the output surface (the impedance boundary is correctly set). [Case Summary] ■ Analysis Module: PHOTO-WAVEjω ■ Analysis Results - It can be seen that there is no reflection at the output surface since the absolute value of the electric field on the polyethylene side is constant (the impedance boundary is correctly set). - In the calculation of the scattering matrix, the characteristic impedances of air and polyethylene were set as ZAir = 279.052Ω and ZPE = 156.987Ω. *For more details, please refer to the related links or feel free to contact us.
We conducted an analysis using the finite element method to determine the distribution of electromagnetic waves input from each port in a T-shaped waveguide used for signal processing in radar and other applications. Three ports were set up in the E-plane T-junction waveguide. Due to symmetry, a 1/2 model was created, with natural boundary conditions on the XY plane and symmetric boundary conditions on the other sides. As a result, the absolute values of S31 and S13 calculated were 0.644 and 0.631, respectively, with an error of 2.0%. [Case Summary] ■ Analysis Module: PHOTO-WAVEjω ■ Analysis Results - The absolute values of S31 and S13 calculated were 0.644 and 0.631, respectively, with an error of 2.0%. *For more details, please refer to the related links or feel free to contact us.
【Features】 ○Outstanding cost performance Low price. An annual license (including maintenance fees) can be obtained for a fixed amount each year. ○Dedicated to the PHOTO series Adopts a dialog similar to that of the PHOTO series. Settings for material properties and other parameters can be smoothly handled through familiar dialogs from both pre- and post-processing. ○Streamlined functionality Equipped only with the necessary functions for electromagnetic field analysis. Does not require expensive pre- and post-processors with many advanced features. Ideal for simple analyses. ○Expanded options Currently, the "PHOTO series" also utilizes Femap, a general-purpose finite element method pre-processor from Siemens USA. By effectively using the high functionality of FEMAP and the cost performance of "GRADE" in appropriate contexts, users can achieve flexible usage on their side. ●For other functions and details, please contact us.
■Efficient Work Environment It integrates a series of tasks from geometry creation/modification to finite element model creation and post-processing, providing an efficient and waste-free work environment. ■High Versatility and Neutral Stance in CAE Equipped with interfaces compatible with numerous CAD data and solvers, it offers high versatility, allowing for a neutral stance in encompassing CAE and can serve as a central presence in analysis solutions. ■High Track Record and Reliability Used Worldwide It is utilized across various industries worldwide, including automotive, shipbuilding, aerospace, heavy industry, architecture and construction, precision engineering, and electronics, and continues to be chosen by many engineers due to its high track record and reliability. Among numerous pre- and post-processors, Simcenter Femap has established a solid position as a cost-effective, high-functionality, and user-friendly software. ■Cutting-Edge Features for Over 20 Years Even after more than 20 years since its inception, it continues to expand its features aimed at improving usability and performance. It supports 64-bit environments and is capable of handling large-scale models.
The PHOTO series is a general-purpose electromagnetic field analysis software developed to simulate electromagnetic phenomena utilized in a wide range of fields using computers. Although electromagnetic phenomena can be broadly categorized, the application areas of electromagnetism are extensive, and various numerical analysis methods have been devised. Furthermore, in real product design, it is necessary to evaluate not only the electromagnetic field but also various derived phenomena. To address these issues, the PHOTO series adopts the following methods: - Provides optimal solvers tailored to various application areas, from high-frequency electromagnetic waves to low-frequency electric and magnetic fields. - Each solver is composed of program modules for different analysis methods, allowing the selection of numerical analysis techniques suitable for the problem at hand. - Enables coupled analysis execution, such as electromagnetic fields and heat conduction, electromagnetic forces and structural deformation, and vibrations, through combinations of modules. - Offers a product configuration that allows the selection of efficient modules according to various problems. Our company provides these modules as products combined with standard applications in mind. If there is a request to build a special analysis system, we also accommodate customization based on these module groups.
3D high-frequency electromagnetic field analysis software using the finite element method (high-frequency electromagnetic field simulator) with a module for frequency response analysis. ■□■Features■□■ ■Since it is integrated with the PHOTO series pre- and post-processing, data creation, analysis, and result processing can be performed as a series of operations. ■It is integrated with other PHOTO series modules, allowing for easy coupled analysis, such as deriving temperature distribution from heat generation obtained through electromagnetic field analysis. ■A revolutionary speedup has been achieved by combining the edge element method and ICCG method. Therefore, 3D electromagnetic wave analysis (high-frequency analysis) can be performed on a personal computer. ■Since it uses the finite element method, it is suitable for analyzing closed regions, especially those involving multiple media. ■When coupled with the thermal conduction analysis software PHOTO-THERMO, it is possible to calculate temperature distribution from heat generation within dielectrics.